“Pics too, make Epics.” –Muhammed Fazil Mohideen Pitchai
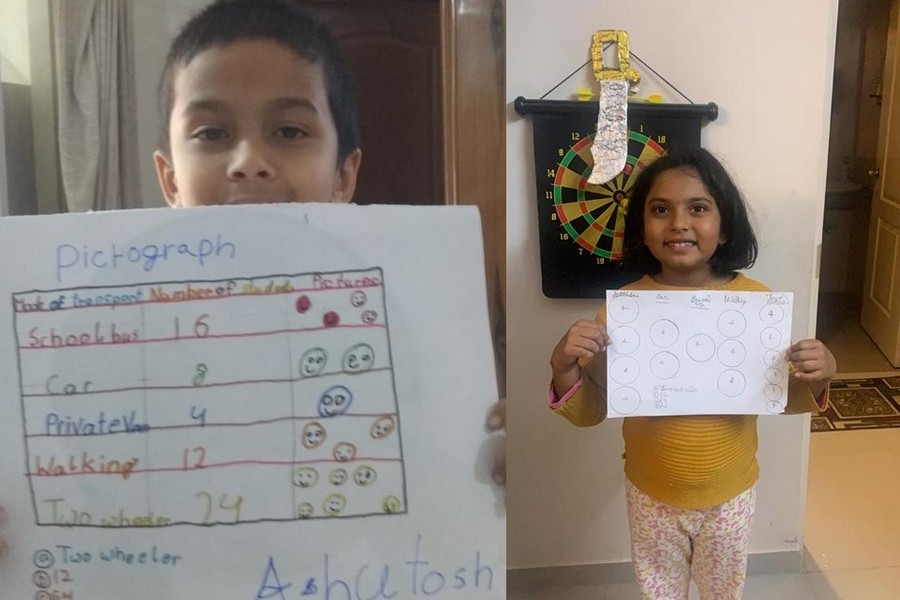
A pictograph is a graph that shows numerical information by using symbols or icons to represent data sets. The advantage of using a pictograph is that it is easy to read and visualize the data.
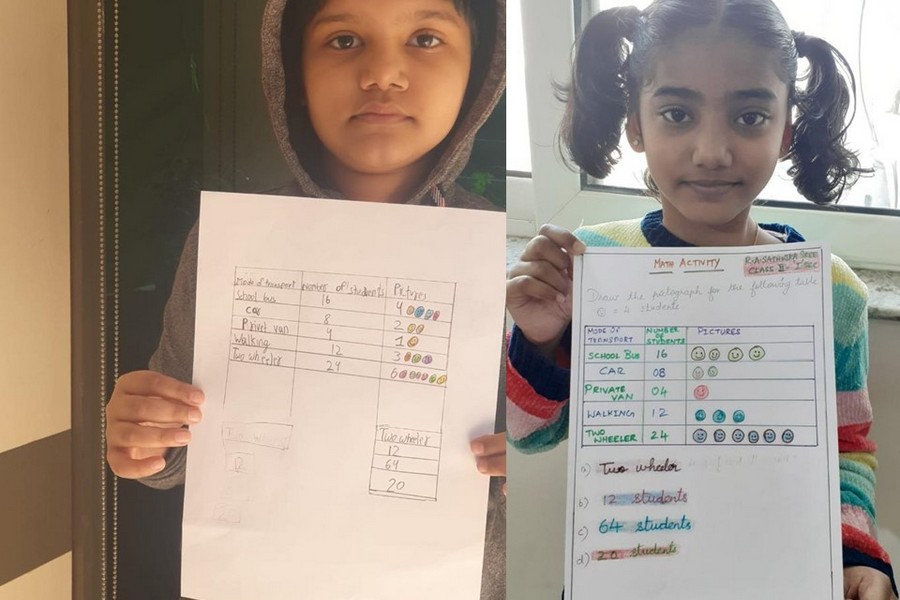
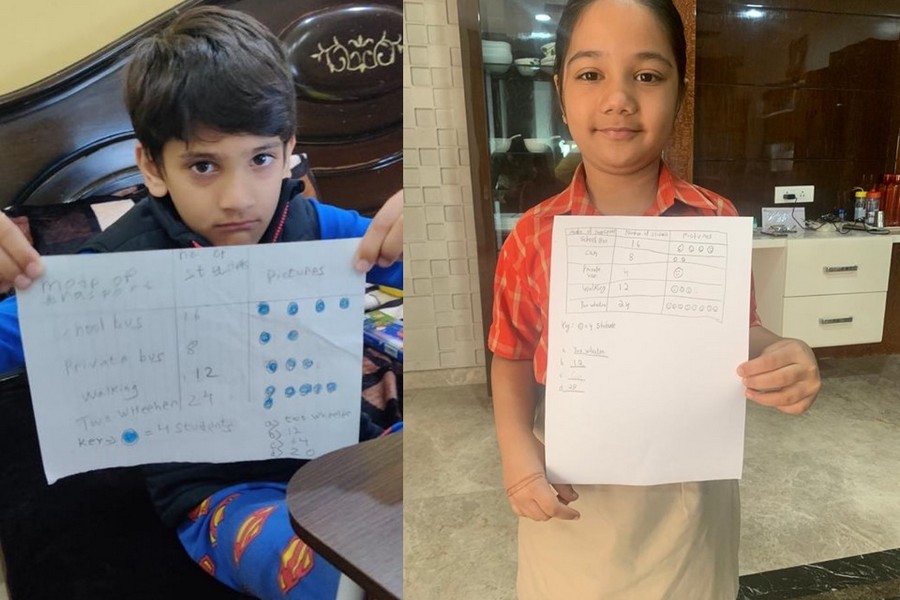
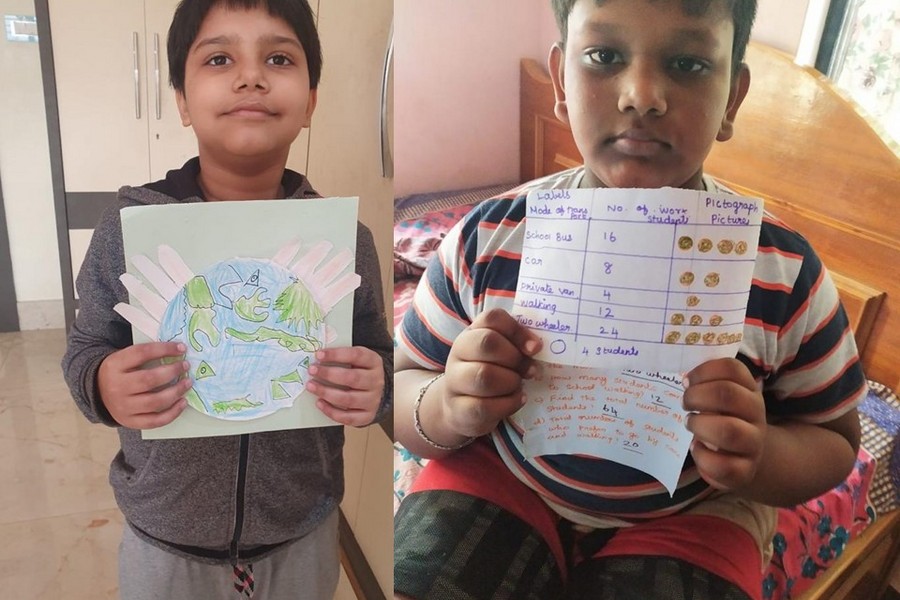
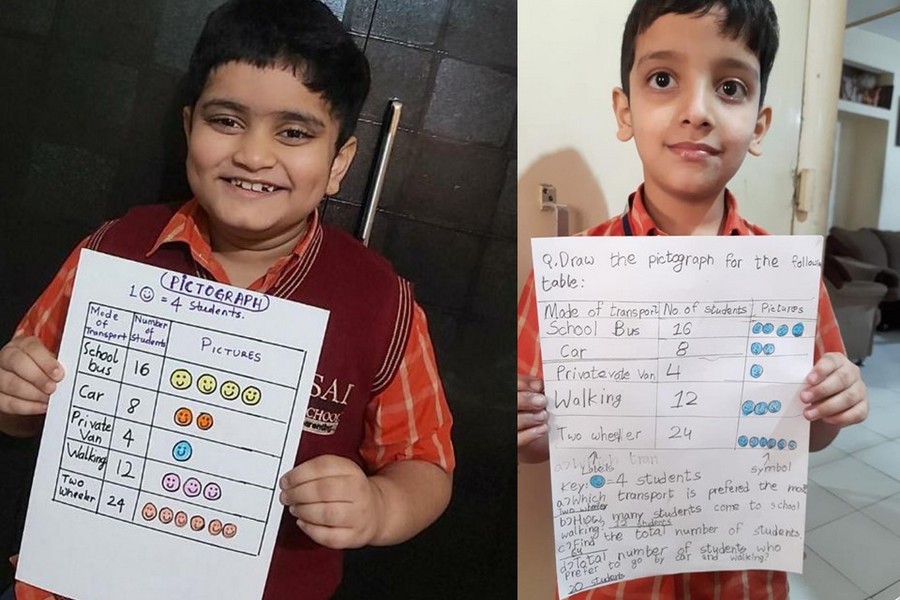
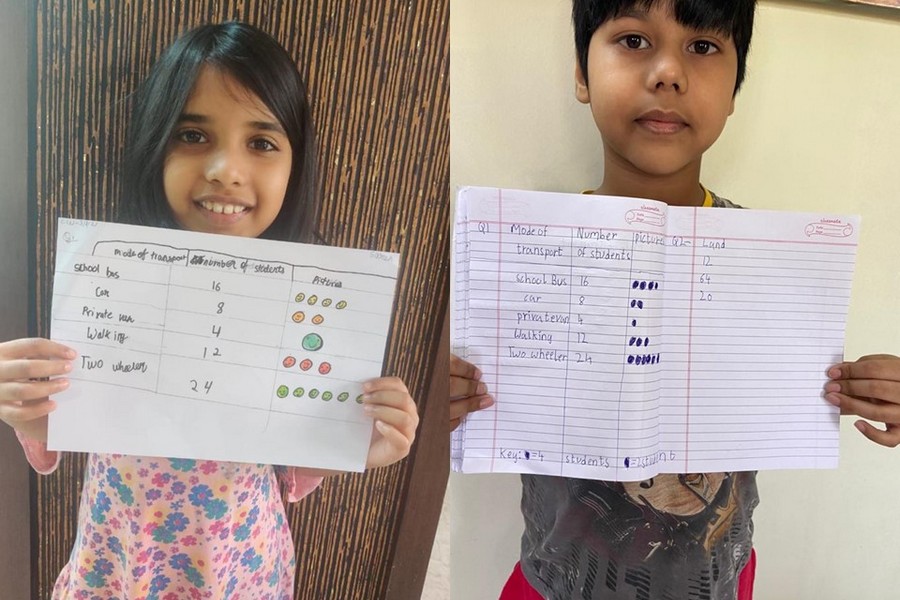
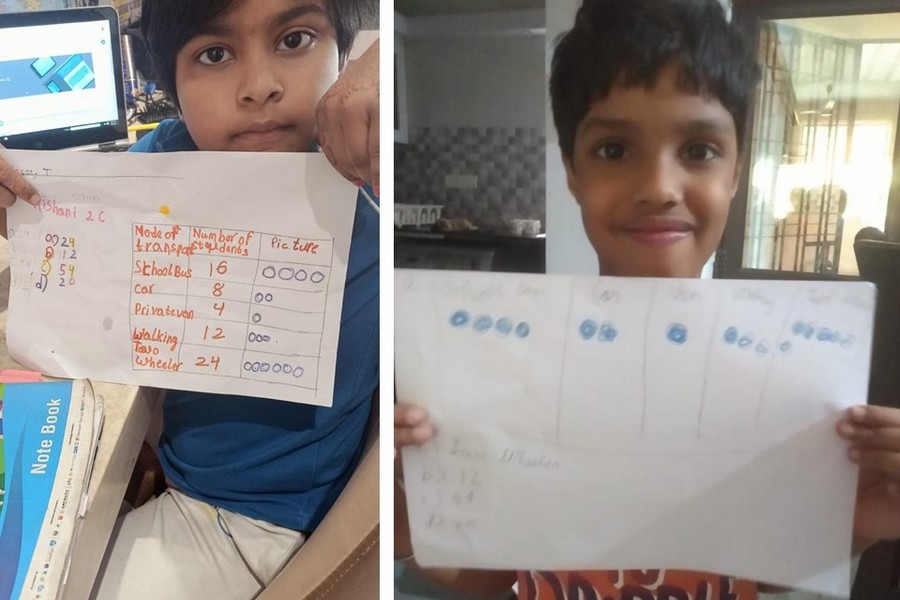
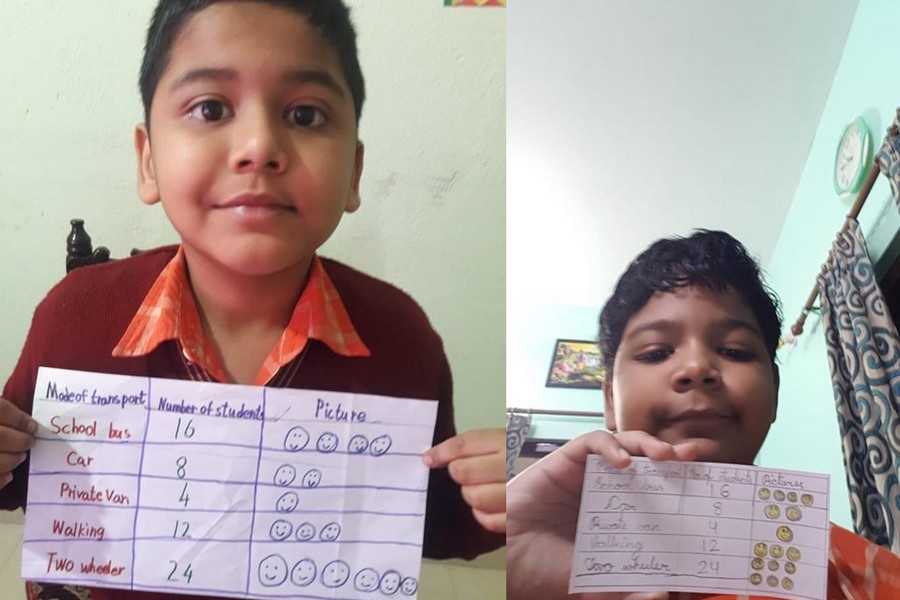
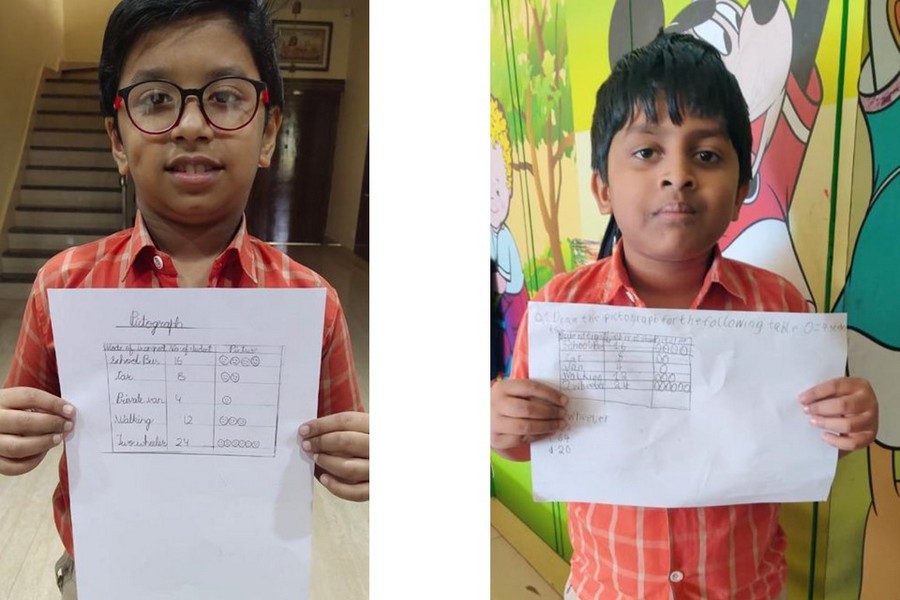
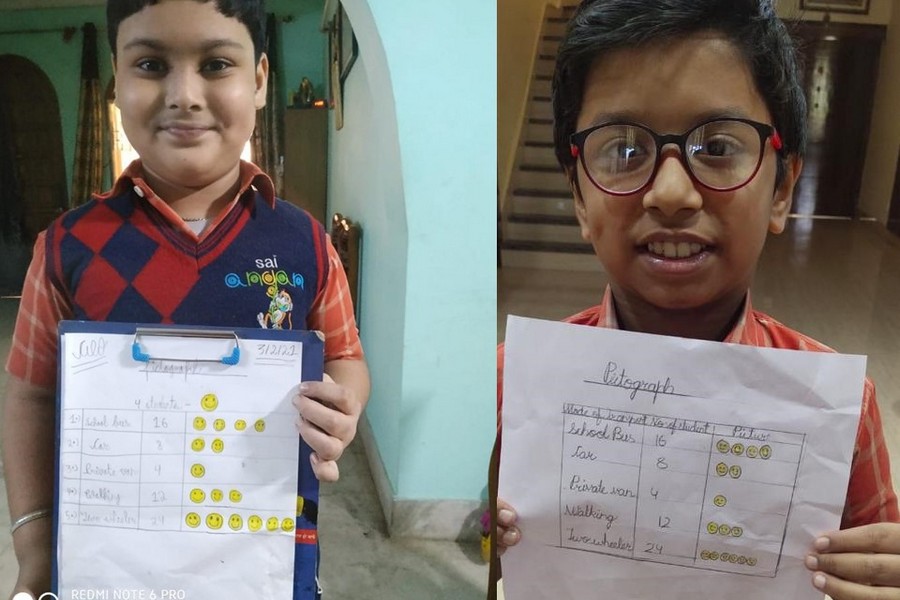
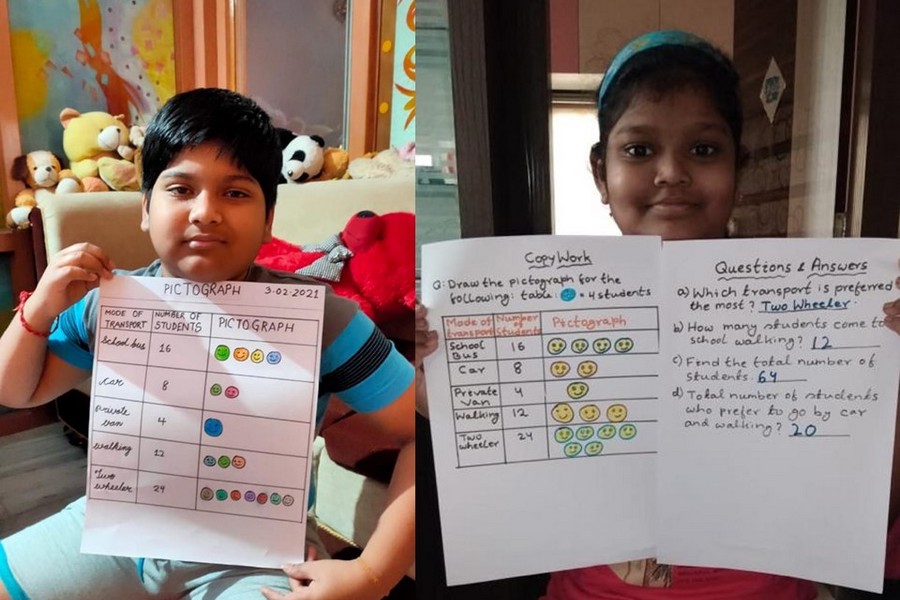
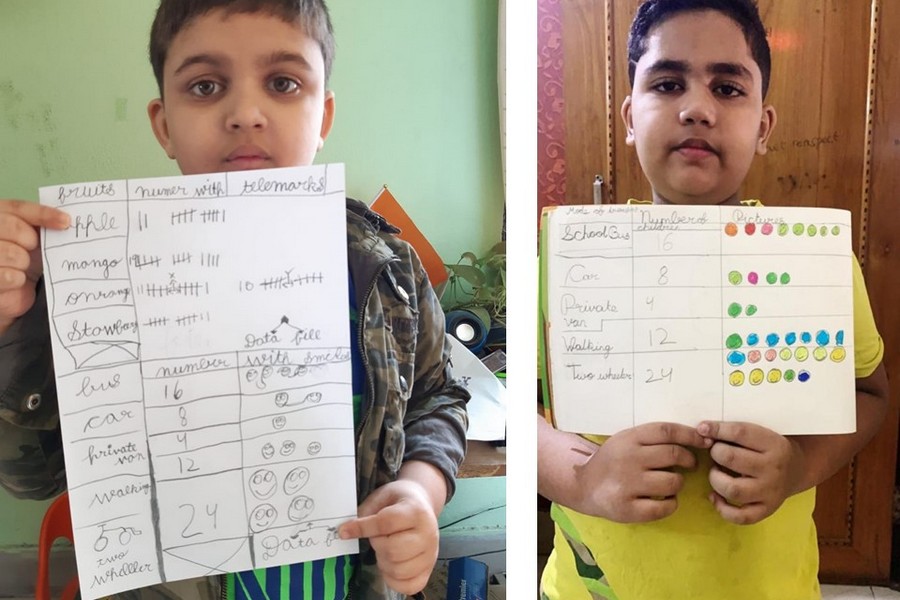
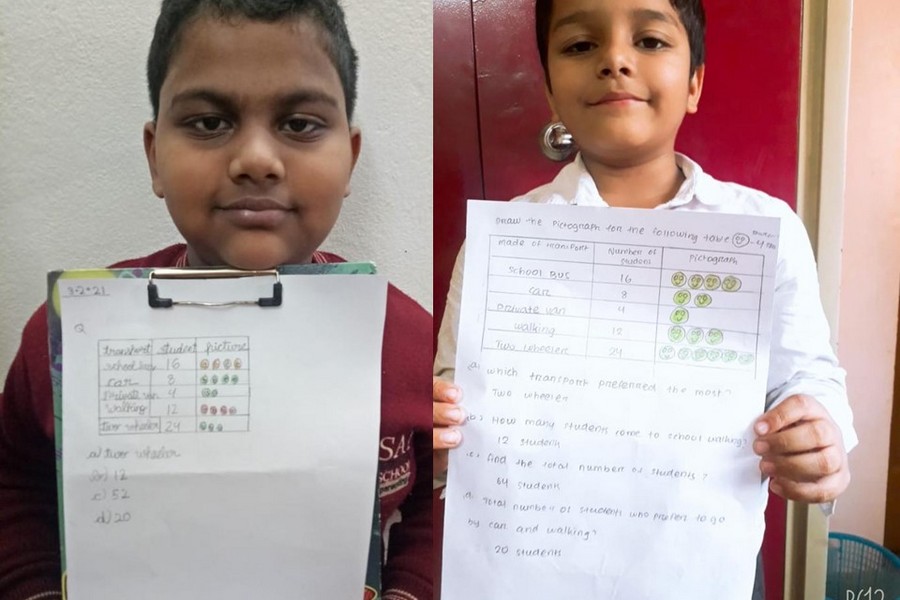
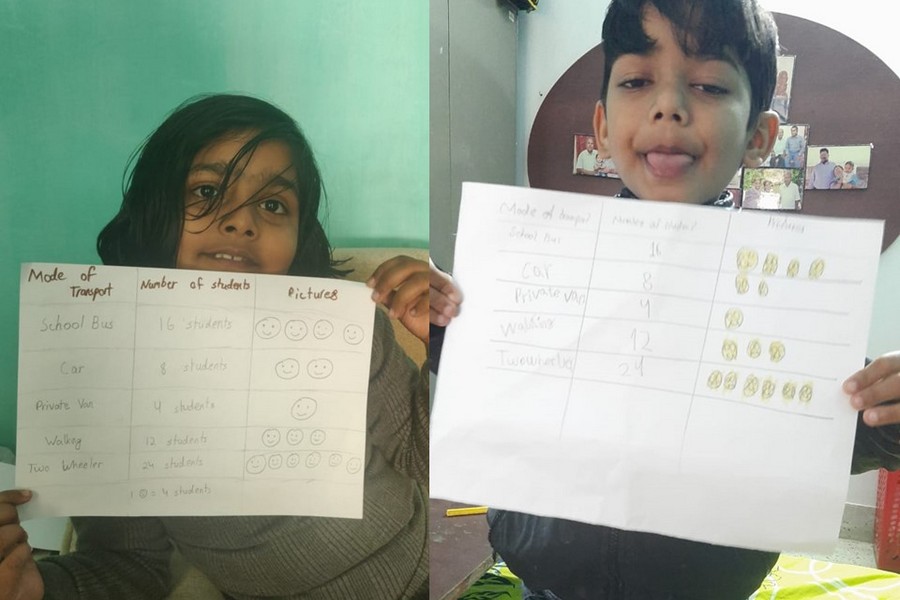
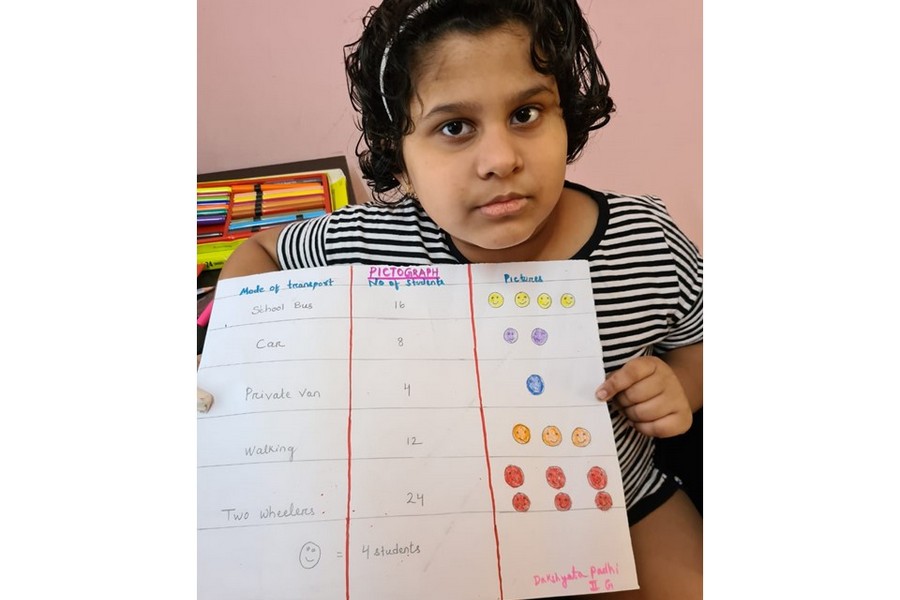
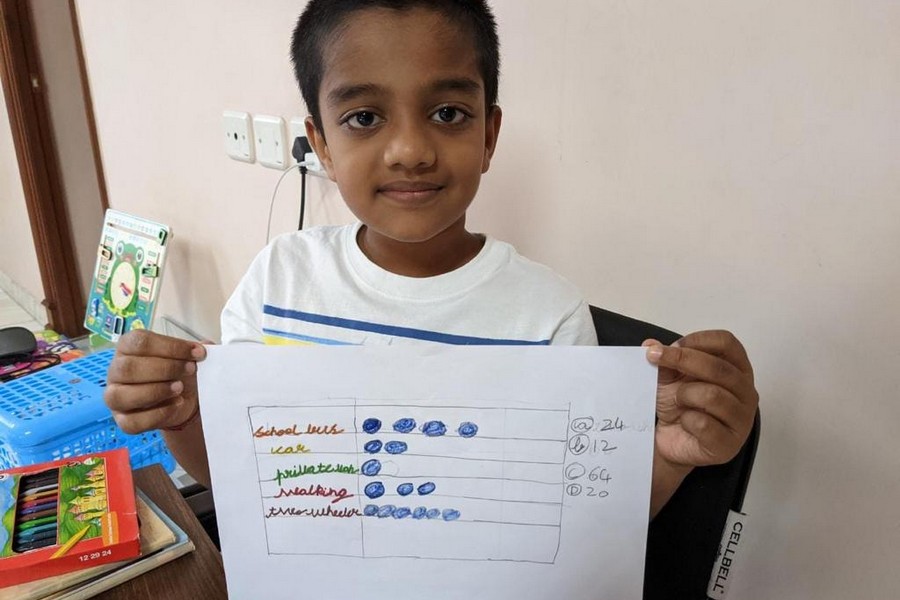
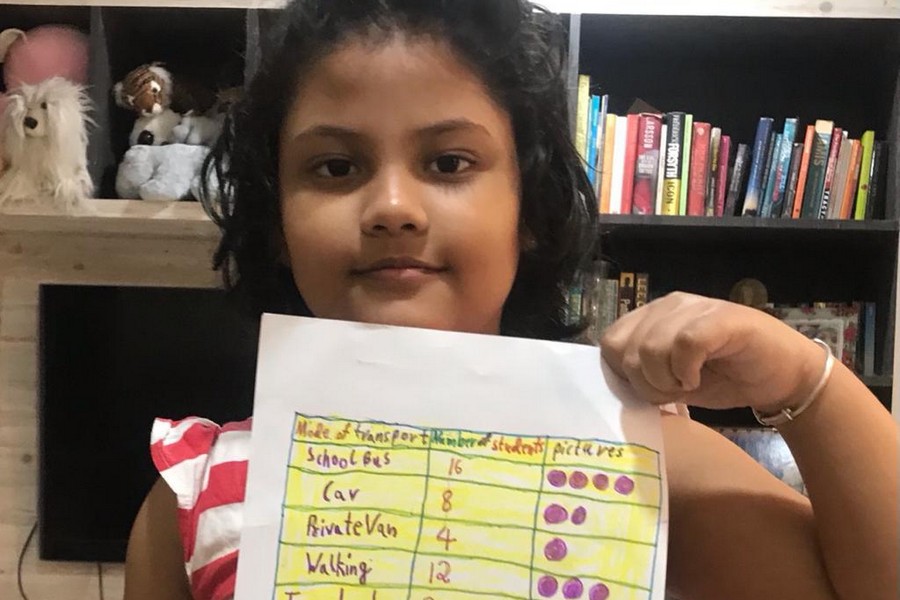
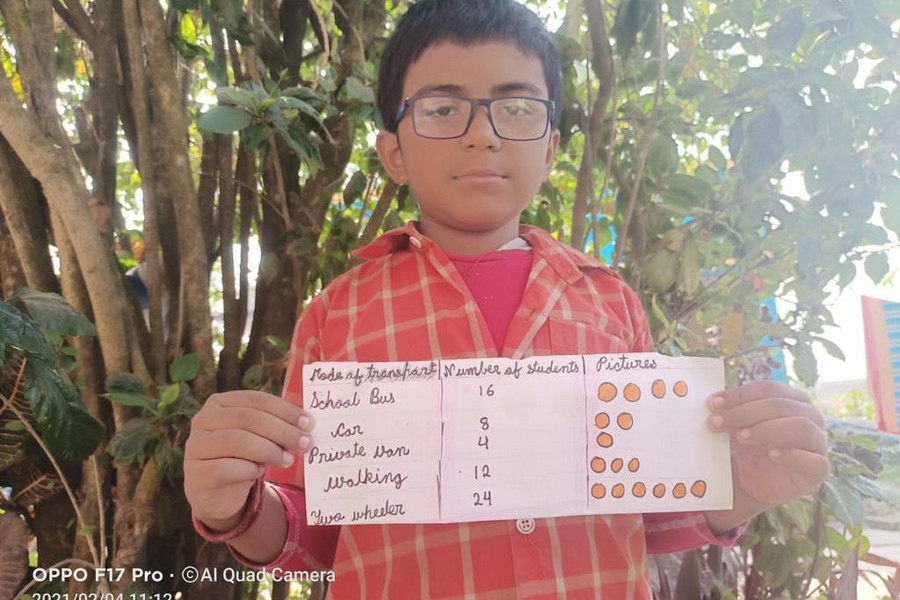
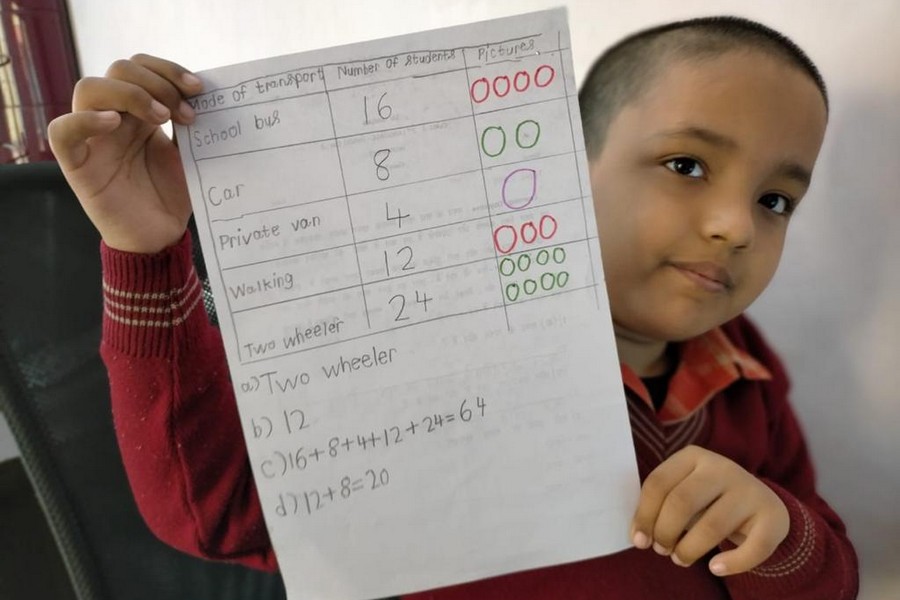
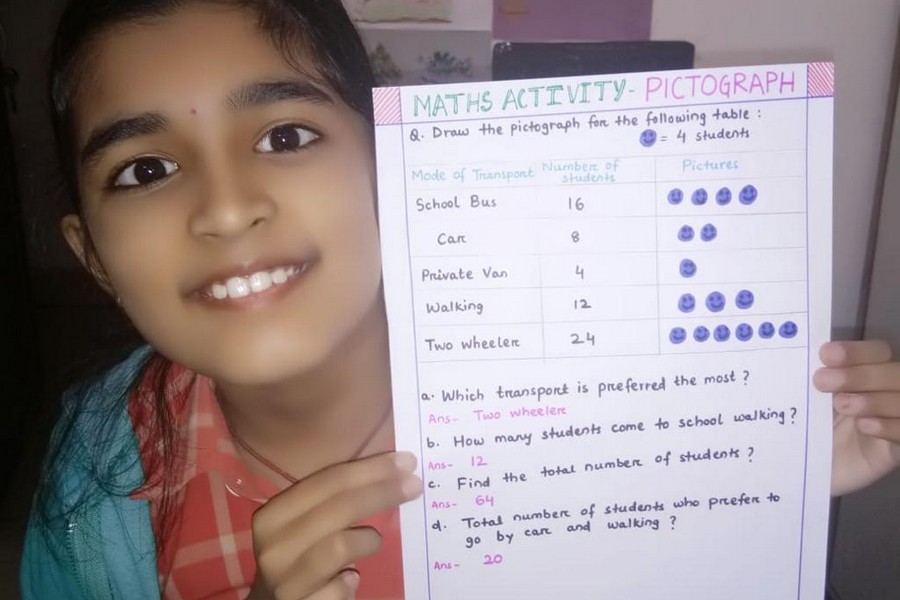
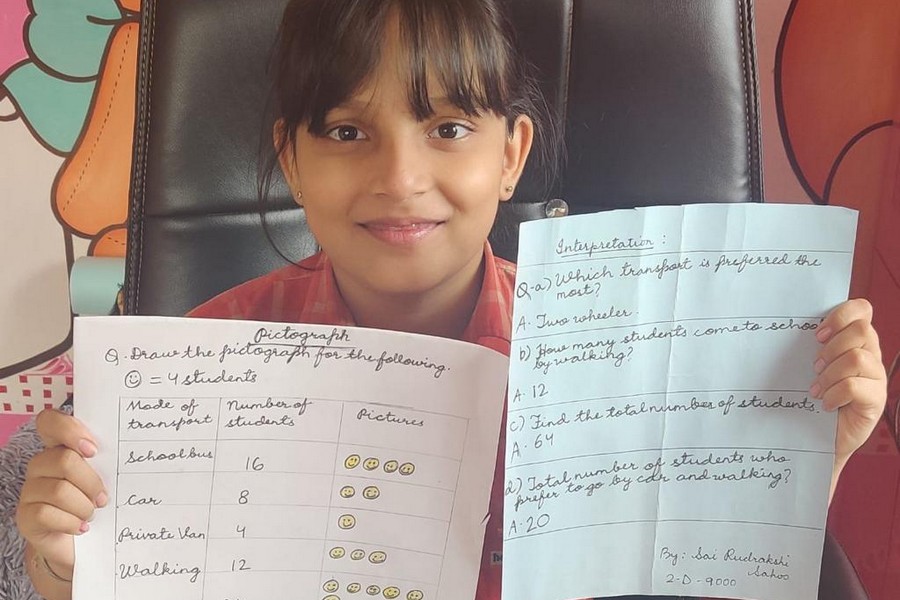
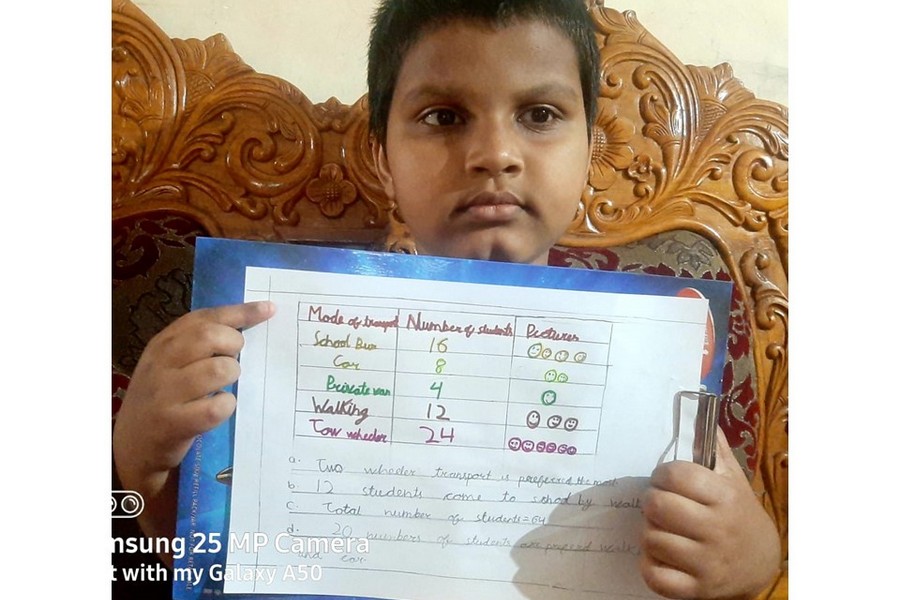
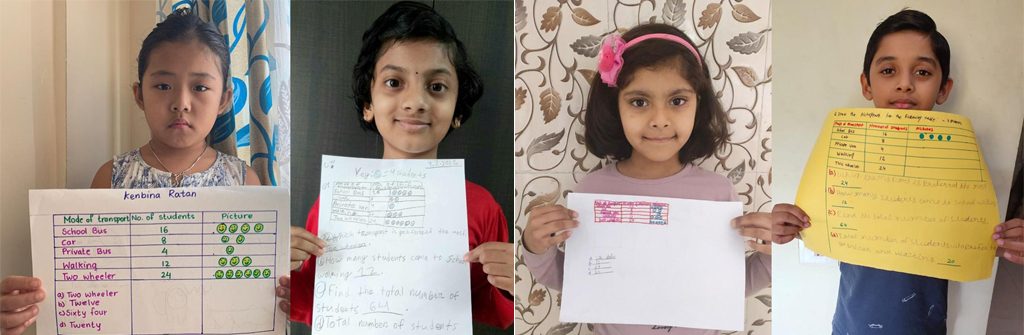
Today SAIoneers of Class II have done an activity related to ‘Pictograph’. The students collected the data of their friends regarding the mode of transport to school used by each student to reach the school (i.e school bus, car, private van,walking or two wheeler) . Then they have used smiley to represent number of students. For example: 1 smiley = 4 students. They have used one A4 size white chart paper and color pencils to represent the pictograph.
Our SAIoneers have enjoyed the activity fully with great enthusiasm. They nicely understood the concept and actively participated. They came to know how pictograph can be easily used to represent any data related to real life examples. For example: varieties of fruits in shop, varieties of balls in toy shop, etc.
Pictograph